.
What Caused Terrestrial Dust Loading and Climate Downturns Between 533 and 540 A.D.? Scanning electron microscope (SEM) micrographs of particles from the ice core. (A, C, E, J) Sn-rich particles with one Fe-rich spherule in E. (B, D, F, G, H) Qualitative energy-dispersive X-ray microanalyses of compositions. (Note that the peak heights are not absolute so no scale is given for peak heights. This means that the relative heights of nearby spectral peaks provide a good estimate of relative abundances of these elements. In contrast, the relative heights of peaks with different energies are only loosely correlated to their relative abundance.) Four out of fi ve analyses are of Sn-rich particles. Analysis D shows a small but distinct Cu peak in addition to Sn peaks. The remaining analysis is of a Fe-rich spherule (F). (I) Ni-rich particle-analysis in Table 3. Ratios of backscattered and secondary electrons were adjusted to maximum the image quality: (A) 100% BSE (backscattered electron mode); (C, I) 50% BSE, 50% ILSE (in-lens secondary electron mode); (E) 90% BSE, 10% ILSE, (J) 50% BSE, 50% SE2 (standard secondary electron mode). Black arrows or lines point from particles to their spectra.

What caused terrestrial dust loading and climate downturns between A.D. 533 and 540?

DOI https://doi.org/10.1130/2014.2505(23)

Abstract

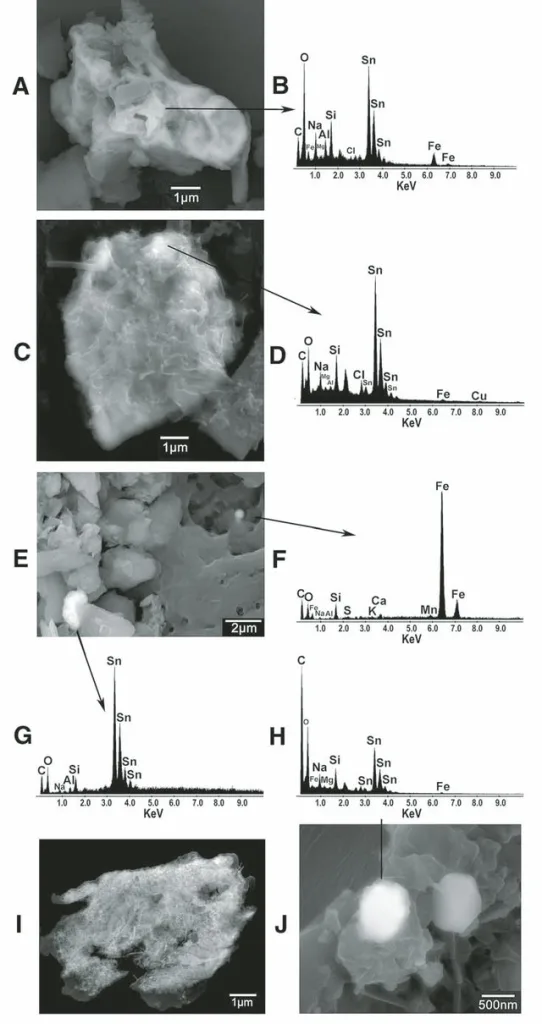
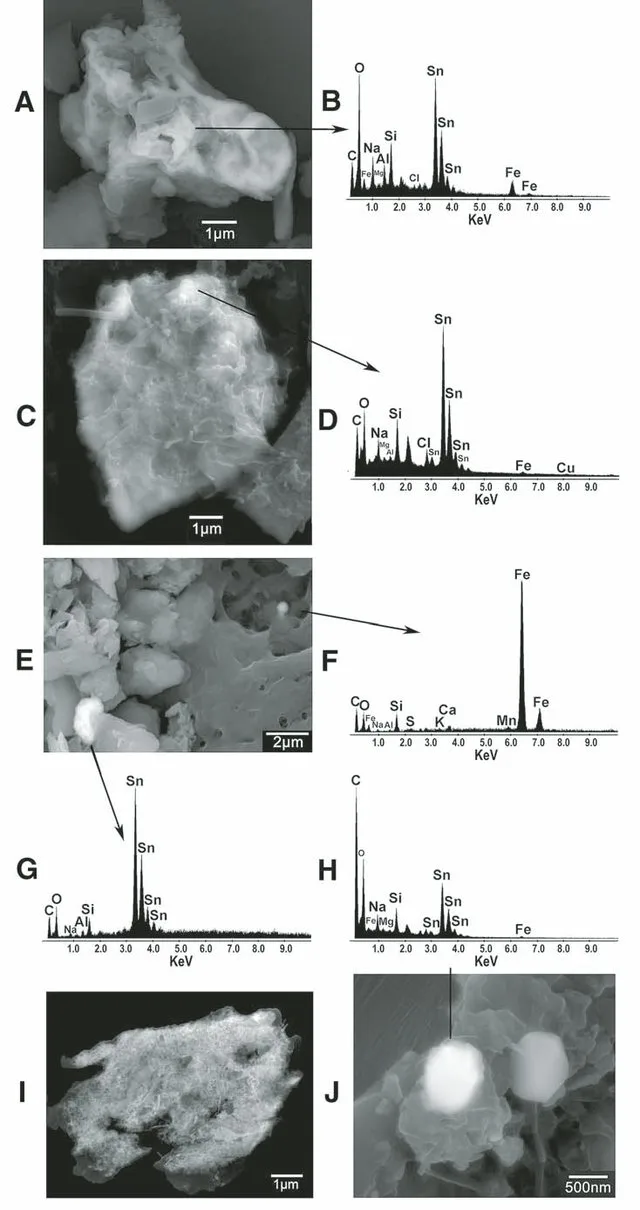
Sn-rich particles, Ni-rich particles, and cosmic spherules are found together at four discrete stratigraphic levels within the 362–360 m depth interval of the Greenland Ice Sheet Project 2 (GISP2) ice core (72.6°N, 38.5°W, elevation: 3203 m). Using a previously derived calendar-year time scale, these particles span a time of increased dust loading of Earth’s atmosphere between A.D. 533 and 540. The Sn-rich and Ni-rich particles contain an average of 10–11 wt% C. Their high C contents coupled with local enrichments in the volatile elements I, Zn, Cu, and Xe suggest a cometary source for the dust. The late spring timing of extraterrestrial input best matches the Eta Aquarid meteor shower associated with comet 1P/Halley. An increased flux of cometary dust might explain a modest climate downturn in A.D. 533. Both cometary dust and volcanic sulfate probably contributed to the profound global dimming during A.D. 536 and 537 but may be insufficient sources of fine aerosols. We found tropical marine microfossils and aerosol-sized CaCO3 particles at the end A.D. 535–start A.D. 536 level that we attribute to a low-latitude explosion in the ocean. This additional source of dust is probably needed to explain the solar dimming during A.D. 536 and 537. Although there has been no extinction documented at A.D. 536, our results are relevant because mass extinctions may also have multiple drivers. Detailed examinations of fine particles at and near extinction horizons can help to determine the relative contributions of cosmic and volcanic drivers to mass extinctions.

Dallas H. Abbott, Dee Breger, Pierre E. Biscaye, John A. Barron, Robert A. Juhl, Patrick McCafferty, 2014. “What caused terrestrial dust loading and climate downturns between A.D. 533 and 540?”, Volcanism, Impacts, and Mass Extinctions: Causes and Effects, Gerta Keller, Andrew C. Kerr https://doi.org/10.1130/2014.2505(23)

What Caused Terrestrial Dust Loading and Climate Downturns Between 533 and 540 A.D.? Scanning electron microscope (SEM) micrographs of particles from the ice core. (A, C, E, J) Sn-rich particles with one Fe-rich spherule in E. (B, D, F, G, H) Qualitative energy-dispersive X-ray microanalyses of compositions. (Note that the peak heights are not absolute so no scale is given for peak heights. This means that the relative heights of nearby spectral peaks provide a good estimate of relative abundances of these elements. In contrast, the relative heights of peaks with different energies are only loosely correlated to their relative abundance.) Four out of fi ve analyses are of Sn-rich particles. Analysis D shows a small but distinct Cu peak in addition to Sn peaks. The remaining analysis is of a Fe-rich spherule (F). (I) Ni-rich particle-analysis in Table 3. Ratios of backscattered and secondary electrons were adjusted to maximum the image quality: (A) 100% BSE (backscattered electron mode); (C, I) 50% BSE, 50% ILSE (in-lens secondary electron mode); (E) 90% BSE, 10% ILSE, (J) 50% BSE, 50% SE2 (standard secondary electron mode). Black arrows or lines point from particles to their spectra.